Plotting
Static plots, animation videos, and a stitched PDF report — every review-grade output PaddockTS produces.
| Function | Output | What it shows |
|---|---|---|
sentinel2_video |
{stub}_sentinel2.mp4 |
True-colour Sentinel-2 timeline, date stamped per frame. |
sentinel2_video_with_paddocks |
{stem}_sentinel2_paddocks.mp4 |
Same, with red paddock boundaries and IDs overlaid. |
fractional_cover_video |
{stub}_fractional_cover.mp4 |
False-colour cover timeline (R=bg, G=pv, B=npv). |
fractional_cover_paddocks_video |
{stem}_fractional_cover_paddocks.mp4 |
Same, with paddock overlays. |
calendar_plot |
{stem}_calendar_<year>_p01.png |
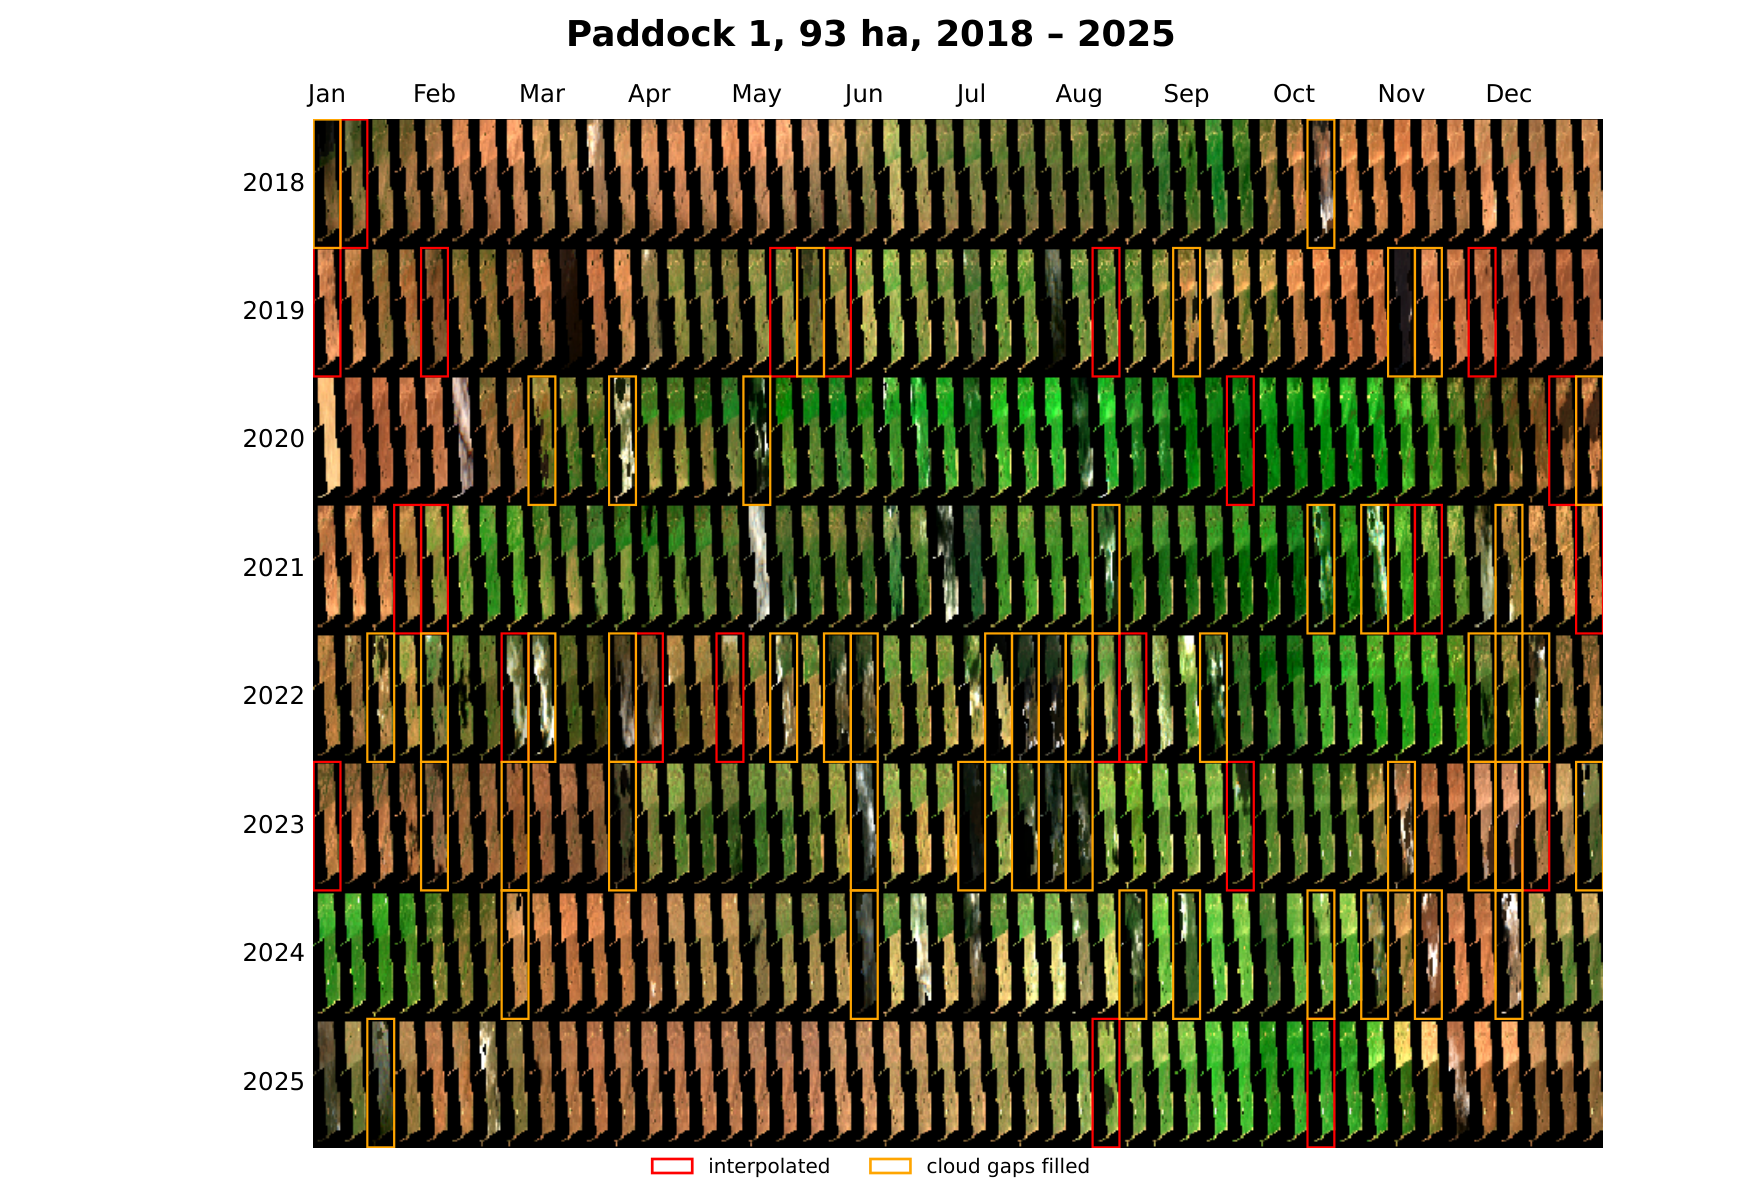
Per-paddock thumbnail calendar (48 slots/year, paddock-masked). |
iter_calendar_figures |
(no file — yields matplotlib Figures) |
Used by make_pdf to embed calendar pages with vector text. |
phenology_plot |
{stem}_phenology_p01.png |
Per-paddock × per-year NDVI curves with SoS / PoS / EoS markers. |
ozwald_daily_plot |
{stub}_ozwald_daily_*.png |
OzWALD climate panels (temperature, precipitation, wind, radiation). |
silo_plot |
{stub}_silo_*.png |
SILO climate panels (temperature, rainfall, radiation, ET, humidity). |
terrain_tiles_plot |
{stub}_topography.png |
2 × 2 panel: elevation, flow accumulation, aspect, slope. |
make_pdf |
{stub}_report.pdf |
Single PDF stitching every plot above, with section headers + PDF metadata. |
All static plots and videos write to {troi.out_dir}/.
Global font defaults
Importing any module from PaddockTS.Plotting runs the package
__init__.py, which bumps matplotlib's default font sizes so ticks,
axis labels, titles, and legends remain readable after the PDF
report's ~0.4× shrink:
# PaddockTS/Plotting/__init__.py — applied at import time
matplotlib.rcParams.update({
    'font.size':       16,
    'axes.titlesize':  20,
    'figure.titlesize': 22,
    'axes.labelsize':  18,
    'xtick.labelsize': 14,
    'ytick.labelsize': 14,
    'legend.fontsize': 14,
    'legend.title_fontsize': 16,
})
Override with plt.rcParams.update(...) at the call site if you need
different sizing for a one-off figure. Calendar text is vector in
the PDF (see below) and uses its own fontsize-in-points constants —
adjusting matplotlib globals there has no effect.
Sentinel-2 videos
Each frame is a normalised RGB composite from nbart_red,
nbart_green, nbart_blue, with the acquisition date stamped in the
top-right corner. Frames are written as PNGs to a temporary directory
then encoded to H.264 with ffmpeg (libopenh264). H.264 requires
even dimensions, so the final size is rounded down to even after
scaling to min_size.
Example
from datetime import date
from troi.troi import Troi
from PaddockTS.Plotting.sentinel2_video import sentinel2_video
from PaddockTS.Plotting.sentinel2_paddocks_video import sentinel2_video_with_paddocks

q = Troi(
    bbox=[148.36265, -33.52606, 148.38265, -33.50606],
    start=date(2024, 1, 1),
    end=date(2024, 12, 31),
    stub="vid_demo",
)

sentinel2_video(q, fps=4, min_size=1080)
# -> {out_dir}/vid_demo_sentinel2.mp4

# With auto SAM paddocks overlaid
sentinel2_video_with_paddocks(q)
# -> {out_dir}/<sam_stem>_sentinel2_paddocks.mp4

# With user paddocks overlaid + custom labels
sentinel2_video_with_paddocks(
    q,
    paddocks_filepath="/path/to/paddocks.gpkg",
    label_col="paddock_name",
)
Reference
PaddockTS.Plotting.sentinel2_video.sentinel2_video 
Encode the Sentinel-2 cube as a true-colour H.264 video.
Parameters:
| Name | Type | Description | Default |
|---|---|---|---|
troi
|
Troi
|
The :class: |
required |
ds_sentinel2
|
Optional in-memory Sentinel-2 dataset. If |
None
|
|
fps
|
int
|
Frames per second. Default 4. |
4
|
min_size
|
int
|
Minimum dimension (height or width) of the output video, in pixels. Smaller cubes are upscaled with nearest-neighbour to ensure legibility; H.264 requires even dimensions, so the final size is rounded down to even. |
1080
|
Returns:
| Name | Type | Description |
|---|---|---|
str |
Filesystem path of the generated MP4. |
Raises:
| Type | Description |
|---|---|
RuntimeError
|
If the |
PaddockTS.Plotting.sentinel2_paddocks_video.sentinel2_video_with_paddocks 
sentinel2_video_with_paddocks(troi: Troi, paddocks_filepath: str | None = None, ds_sentinel2=None, fps: int = 4, min_size: int = 1080, label_col: str | None = None)
Encode a true-colour Sentinel-2 video with paddock outlines + labels.
Parameters:
| Name | Type | Description | Default |
|---|---|---|---|
troi
|
Troi
|
The :class: |
required |
paddocks_filepath
|
str | None
|
Path to the paddocks file. If |
None
|
ds_sentinel2
|
Optional in-memory Sentinel-2 dataset. If |
None
|
|
fps
|
int
|
Frames per second. Default 4. |
4
|
min_size
|
int
|
Minimum dimension (height or width) of the output
video. See :func: |
1080
|
Returns:
| Name | Type | Description |
|---|---|---|
str |
Filesystem path of the generated MP4. |
Raises:
| Type | Description |
|---|---|
RuntimeError
|
If the |
Fractional cover videos
Each frame is a false-colour composite mapping the three fractional cover bands to RGB channels:
- R = bg (bare ground)
- G = pv (green vegetation)
- B = npv (non-green vegetation)
Fractions are renormalised to sum to 1 before display, so a fully bare pixel is pure red, fully green vegetation is pure green, and so on.
Example
from PaddockTS.Plotting.fractional_cover_video import fractional_cover_video
from PaddockTS.Plotting.fractional_cover_paddocks_video import fractional_cover_paddocks_video

fractional_cover_video(q, fps=4, min_size=1080)
# -> {out_dir}/vid_demo_fractional_cover.mp4

fractional_cover_paddocks_video(q)
# -> {out_dir}/<sam_stem>_fractional_cover_paddocks.mp4
Reference
PaddockTS.Plotting.fractional_cover_video.fractional_cover_video 
Encode the fractional-cover cube as a false-colour H.264 video.
Parameters:
| Name | Type | Description | Default |
|---|---|---|---|
troi
|
Troi
|
The :class: |
required |
ds_fractional_cover
|
Optional in-memory fractional cover dataset
(with |
None
|
|
fps
|
int
|
Frames per second. Default 4. |
4
|
min_size
|
int
|
Minimum dimension of the output video in pixels. Smaller cubes are upscaled with nearest-neighbour. H.264 requires even dimensions, so the final size is rounded down. |
1080
|
Returns:
| Name | Type | Description |
|---|---|---|
str |
Filesystem path of the generated MP4. |
Raises:
| Type | Description |
|---|---|
RuntimeError
|
If the |
PaddockTS.Plotting.fractional_cover_paddocks_video.fractional_cover_paddocks_video 
fractional_cover_paddocks_video(troi: Troi, paddocks_filepath: str | None = None, ds_fractional_cover=None, ds_sentinel2=None, fps: int = 4, min_size: int = 1080, label_col: str | None = None)
Encode a fractional-cover video with paddock outlines + labels.
Parameters:
| Name | Type | Description | Default |
|---|---|---|---|
troi
|
Troi
|
The :class: |
required |
paddocks_filepath
|
str | None
|
Path to the paddocks file. If |
None
|
ds_fractional_cover
|
Optional in-memory fractional cover dataset.
If |
None
|
|
ds_sentinel2
|
Optional in-memory Sentinel-2 dataset, used only
to read the rasterisation transform. If |
None
|
|
fps
|
int
|
Frames per second. Default 4. |
4
|
min_size
|
int
|
Minimum dimension of the output video in pixels. |
1080
|
Returns:
| Name | Type | Description |
|---|---|---|
str |
Filesystem path of the generated MP4. |
Raises:
| Type | Description |
|---|---|
RuntimeError
|
If the |
Diagnostic plots
Calendar plot
One page per year (split into multiple pages if there are more paddocks
than max_paddocks_per_page). Rows are paddocks (largest area at top);
columns are 48 evenly-spaced slots across the year (4 per month). Each
cell shows the Sentinel-2 RGB thumbnail of that paddock at the
observation closest to the slot's day-of-year, with non-paddock pixels
masked black.
Now built with matplotlib (was PIL in earlier releases). The
thumbnail grid is composited into a single numpy array and drawn with
one imshow; titles, month names, and paddock labels are matplotlib
text — vector when the page is written into the PDF report, so
labels remain readable at any zoom and aren't subject to the PNG-embed
shrink that capped text at ~13 pt in the previous PIL design.
Two public entry points:
calendar_plot(troi, ...)— saves one rasterised PNG per page undertroi.out_dir(standalone view).iter_calendar_figures(troi, ...)— generator yielding(year, page_idx, fig)triples without touching disk. Used bymake_pdfto embed each page directly into the PDF as vector text.
from PaddockTS.Plotting.calendar_plot import calendar_plot

# Standalone PNGs (rasterised)
calendar_plot(q, thumb_size=64, max_paddocks_per_page=20)
# -> {out_dir}/<stem>_calendar_<year>_p01.png  (one per year × page chunk)
To consume figures programmatically (e.g. embed in your own PDF):
from PaddockTS.Plotting.calendar_plot import iter_calendar_figures
import matplotlib.pyplot as plt

for year, page_idx, fig in iter_calendar_figures(q):
    fig.savefig(f"/tmp/cal_{year}_p{page_idx}.svg")  # vector
    plt.close(fig)
PaddockTS.Plotting.calendar_plot.calendar_plot 
calendar_plot(troi: Troi, ds_sentinel2: Dataset | None = None, paddocks_filepath: str | None = None, thumb_size: int = 64, label_col: str | None = None) -> list[str]
Render and save one calendar PNG per paddock.
Each PNG shows that paddock across every year in the troi. They are
matplotlib-rasterized at 200 dpi for standalone viewing; for the PDF
report, :mod:PaddockTS.Plotting.make_pdf calls
:func:iter_calendar_figures directly so the text stays vector.
Parameters:
| Name | Type | Description | Default |
|---|---|---|---|
troi
|
Troi
|
The :class: |
required |
ds_sentinel2
|
Dataset | None
|
Optional in-memory cleaned Sentinel-2 dataset. If
|
None
|
paddocks_filepath
|
str | None
|
Path to the paddocks file. If |
None
|
thumb_size
|
int
|
Edge length of each thumbnail in pixels (input resolution; matplotlib resizes for display). Default 64. |
64
|
label_col
|
str | None
|
Column in the paddocks GeoDataFrame to use for the
per-page title. |
None
|
Returns:
| Type | Description |
|---|---|
list[str]
|
list[str]: Paths of the generated PNGs (one per paddock). |
PaddockTS.Plotting.calendar_plot.iter_calendar_figures 
iter_calendar_figures(troi: Troi, paddocks_filepath: str | None = None, ds_sentinel2: Dataset | None = None, thumb_size: int = 64, label_col: str | None = None) -> Iterator[tuple[int, plt.Figure]]
Yield (paddock_id, fig) — one page per paddock.
Each figure shows that paddock across every year in the troi (years as rows, months as columns), so the same paddock can be compared year-over-year, and every paddock starts on a fresh page. Paddocks are yielded largest-area first.
Does not write to disk. Used by :mod:PaddockTS.Plotting.make_pdf
to embed each page directly into the report PDF as a vector-text
page. The caller is responsible for plt.close(fig) after
consuming each Figure.
Phenology plot
Multi-panel PNG: rows are paddocks, columns are years. Each panel overlays the raw vegetation-index series (filled blue dots) and the resampled-and-smoothed series (open blue dots) on a DOY axis, with SoS / PoS / EoS DOYs drawn as vertical reference lines.
Font sizes come from the package-wide matplotlib rcParams (see Global font defaults above).
from PaddockTS.Plotting.phenology_plot import phenology_plot

phenology_plot(q, variable="NDVI", max_paddocks_per_page=8)
# -> {out_dir}/<stem>_phenology_p01.png
PaddockTS.Plotting.phenology_plot.phenology_plot 
phenology_plot(troi: Troi, phenology_results: dict[int, DataFrame] | None = None, ds_yearly: dict[int, Dataset] | None = None, ds_paddockTS: Dataset | None = None, variable: str = 'NDVI', paddocks_filepath: str | None = None, max_paddocks_per_page: int = 8, label_col: str | None = None) -> list[str]
Plot per-paddock × per-year phenology curves with SoS / PoS / EoS markers.
Parameters:
| Name | Type | Description | Default |
|---|---|---|---|
troi
|
Troi
|
The :class: |
required |
phenology_results
|
dict[int, DataFrame] | None
|
Optional |
None
|
ds_yearly
|
dict[int, Dataset] | None
|
Optional |
None
|
ds_paddockTS
|
Dataset | None
|
Deprecated and unused. Retained for backward compatibility with callers that still pass it (the raw overlay was removed in favour of plotting only the sampled + interpolated series, matching the web viewer). |
None
|
variable
|
str
|
Vegetation index column to plot. Default |
'NDVI'
|
paddocks_filepath
|
str | None
|
Path to the paddocks file. Used to derive
the output filename stem. If |
None
|
max_paddocks_per_page
|
int
|
Maximum number of paddocks per output image. Default 8. Prevents images from becoming too tall with many paddocks. |
8
|
label_col
|
str | None
|
Column name to use for paddock labels. If |
None
|
Returns:
| Type | Description |
|---|---|
list[str]
|
list[str]: Filesystem paths of the generated PNGs. |
OzWALD climate plot
One PNG per group (temperature, precipitation, wind, radiation).
Reads the cached daily CSV produced by download_ozwald_daily.
from PaddockTS.Plotting.ozwald_plot import ozwald_daily_plot

ozwald_daily_plot(q)
# -> {out_dir}/<stub>_ozwald_daily_temperature.png
# -> {out_dir}/<stub>_ozwald_daily_precipitation.png
# -> {out_dir}/<stub>_ozwald_daily_wind.png
# -> {out_dir}/<stub>_ozwald_daily_radiation.png
PaddockTS.Plotting.ozwald_plot.ozwald_daily_plot 
Plot OzWALD daily climate variables grouped by theme.
Reads the daily series from the machine-wide :mod:pyozwald store
and writes one PNG per group to
{troi.out_dir}/{troi.stub}_ozwald_daily_{group}.png.
Parameters:
| Name | Type | Description | Default |
|---|---|---|---|
troi
|
Troi
|
The :class: |
required |
groups
|
dict
|
Optional override of the default grouping. Maps a group
name to |
None
|
SILO climate plot
One PNG per group (temperature, rainfall, radiation, evapotranspiration,
humidity). Reads the cached SILO CSV produced by download_silo.
from PaddockTS.Plotting.silo_plot import silo_plot

silo_plot(q)
# -> {out_dir}/<stub>_silo_temperature.png  ... etc.
PaddockTS.Plotting.silo_plot.silo_plot 
Plot SILO climate variables grouped by theme.
Fetches the daily SILO series from the machine-wide pysilo store
(downloading only what's missing) and writes one PNG per group to
{troi.out_dir}/{troi.stub}_silo_{group}.png.
Parameters:
| Name | Type | Description | Default |
|---|---|---|---|
troi
|
Troi
|
The :class: |
required |
groups
|
dict
|
Optional override of the default grouping. If |
None
|
Terrain plot
2 × 2 panel: elevation, D8 flow accumulation, aspect, slope. Reads
the Copernicus DEM downloaded by download_terrain, applies a Gaussian
smoother before flow analysis (sharp DEMs produce striped artefacts),
and reprojects to the Sentinel-2 grid for easy overlay.
from PaddockTS.Plotting.terrain_tiles_plot import terrain_tiles_plot

terrain_tiles_plot(q, sigma=10)
# -> {out_dir}/<stub>_topography.png
PaddockTS.Plotting.terrain_tiles_plot.terrain_tiles_plot 
Plot a 2 × 2 panel of elevation, flow accumulation, aspect, and slope.
Parameters:
| Name | Type | Description | Default |
|---|---|---|---|
troi
|
Troi
|
The :class: |
required |
ds_sentinel2
|
Optional in-memory Sentinel-2 dataset, used as the
spatial reference grid that the terrain tiles are
reprojected onto. If |
None
|
|
sigma
|
int
|
Standard deviation of the Gaussian smoother applied to the DEM before flow analysis, in pixels. Larger values produce smoother, less-striped flow fields at the cost of losing fine drainage detail. Default 10. |
10
|
Returns:
| Name | Type | Description |
|---|---|---|
str |
Filesystem path of the generated PNG. |
PDF report
make_pdf stitches the plots produced for a troi into a single
A4-landscape PDF with section headers — Landscape (topography),
Climate (SILO, OzWALD), Satellite Calendar (SAM + user paddocks),
Phenology (SAM + user paddocks).
Output: {troi.out_dir}/{troi.stub}_report.pdf.
from PaddockTS.Plotting.make_pdf import make_pdf

# SAM-only report
make_pdf(q)

# Include user-paddocks sections too, with custom row labels in the
# user calendar
make_pdf(q, paddocks_filepath="/path/to/paddocks.gpkg",
         label_col="paddock_name")
What's in the PDF
- PDF metadata —
Title,Author,Subject(includes bbox + dates),Keywords, andCreatorare set on the document so the report shows up cleanly in viewer tabs and file-manager properties. - Cover page with the troi stub, dates, and bbox.
- Sections — each one has a header page followed by its content.
Sections marked
requires_user_paddocks=True(the User-paddocks calendar + phenology) are skipped if nopaddocks_filepathis passed. - Calendar pages are written into the PDF as matplotlib figures
directly (via
iter_calendar_figures), so titles, month labels, and paddock labels are vector text — full-size in the report, not subject to the PNG-embed shrink that affects other image-based sections. - Other image pages (topography, climate panels, phenology) are embedded from the PNGs on disk. Rasterised at 220 DPI (was matplotlib's default 100 DPI) so small text stays crisp.
How sections are declared
The SECTIONS module-level list defines the report layout. Each
entry is a 3-tuple (title, plot_patterns, requires_user_paddocks):
SECTIONS = [
    ('Landscape',                 [('Topography', '{stub}_topography.png')], False),
    ('Climate – SILO',            [...], False),
    ('Climate – OzWALD',          [...], False),
    ('Satellite Calendar (SAM)',  [...], False),
    ('Satellite Calendar (User)', [...], True),   # skipped without paddocks_filepath
    ('Phenology (SAM)',           [...], False),
    ('Phenology (User)',          [...], True),
]
The patterns use {stub} / {sam_stem} / {user_stem} placeholders,
expanded to filesystem globs against troi.out_dir.
PaddockTS.Plotting.make_pdf.make_pdf 
Generate a PDF report combining all plots for a troi.
Parameters:
| Name | Type | Description | Default |
|---|---|---|---|
troi
|
Troi
|
The :class: |
required |
paddocks_filepath
|
str | None
|
Optional path to the user-provided paddocks file. If provided, includes user paddock calendar and phenology plots in the report. |
None
|
label_col
|
str | None
|
Column in the user paddocks file to use for per-row
labels in the user-paddocks calendar pages. Ignored for the
SAM calendar (which always uses the numeric |
None
|
Returns:
| Name | Type | Description |
|---|---|---|
str |
Filesystem path of the generated PDF. |